Turn security work into a measurable trajectory
Project Analytics combines AI tools, static analyzers, agents, and human auditors in one view, then tracks how the project responds to their findings.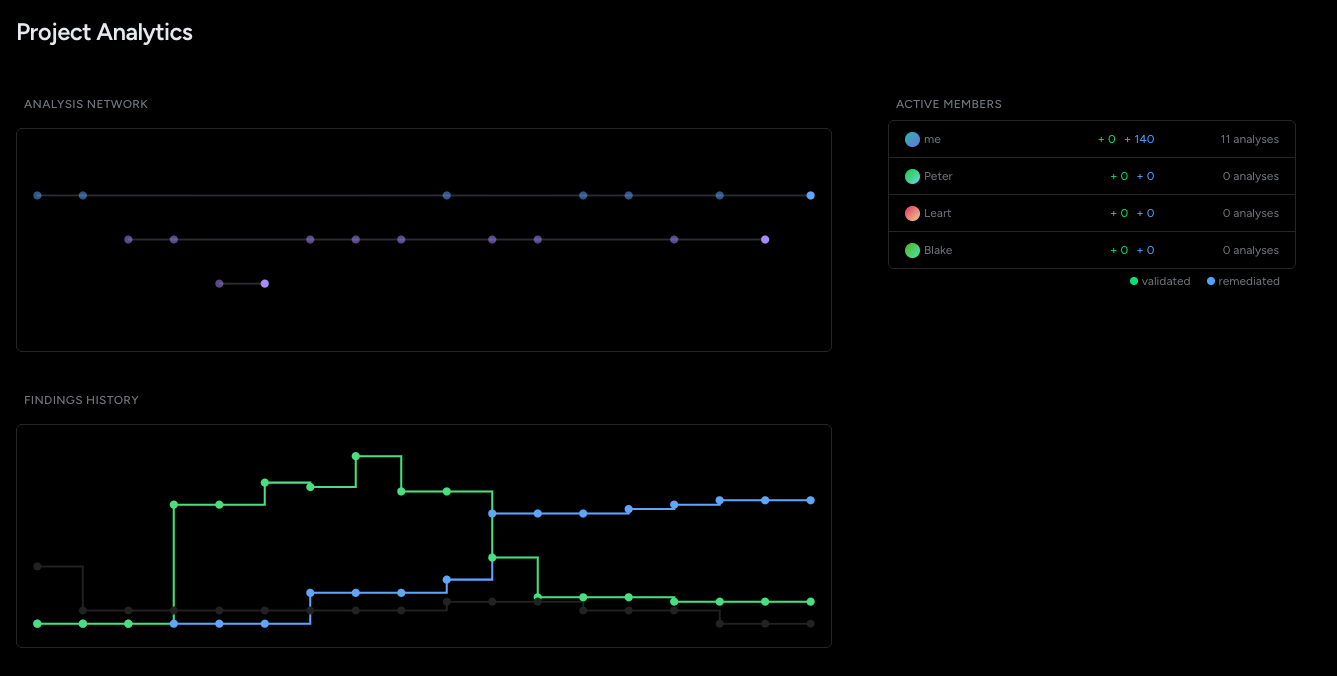
Project analytics showing the analysis network, active members, and findings history
Read the dashboard
- Analysis network: Security work across code versions and branches.
- Active members: Validation and remediation by people and systems.
- Findings history: Discovered risk becoming verified remediation.
The shape of good security posture
A stronger security program may surface more findings at first. That means previously unknown risk is becoming visible.- Surface broadly: Apply overlapping models, analyzers, agents, and human review.
- Validate: Remove duplicates and false positives; identify real risk.
- Remediate and verify: Open validated findings trend toward zero while verified remediations trend upward.
Zero findings from one tool is not the same as zero risk. Confidence comes from diverse analysis, independent validation, and evidence that confirmed issues were remediated.